August 29th, 2025
New
New concept graph: Your knowledge, visualized
Lists are great for organizing, but true understanding comes from seeing the connections. We've always believed that without a narrative, data is just noise. Today, we're helping you find that narrative by introducing a powerful new way to visualize your knowledge.
The Concept Graph is a new feature that transforms the concepts extracted from your Collections into a living, interactive map of your knowledge.
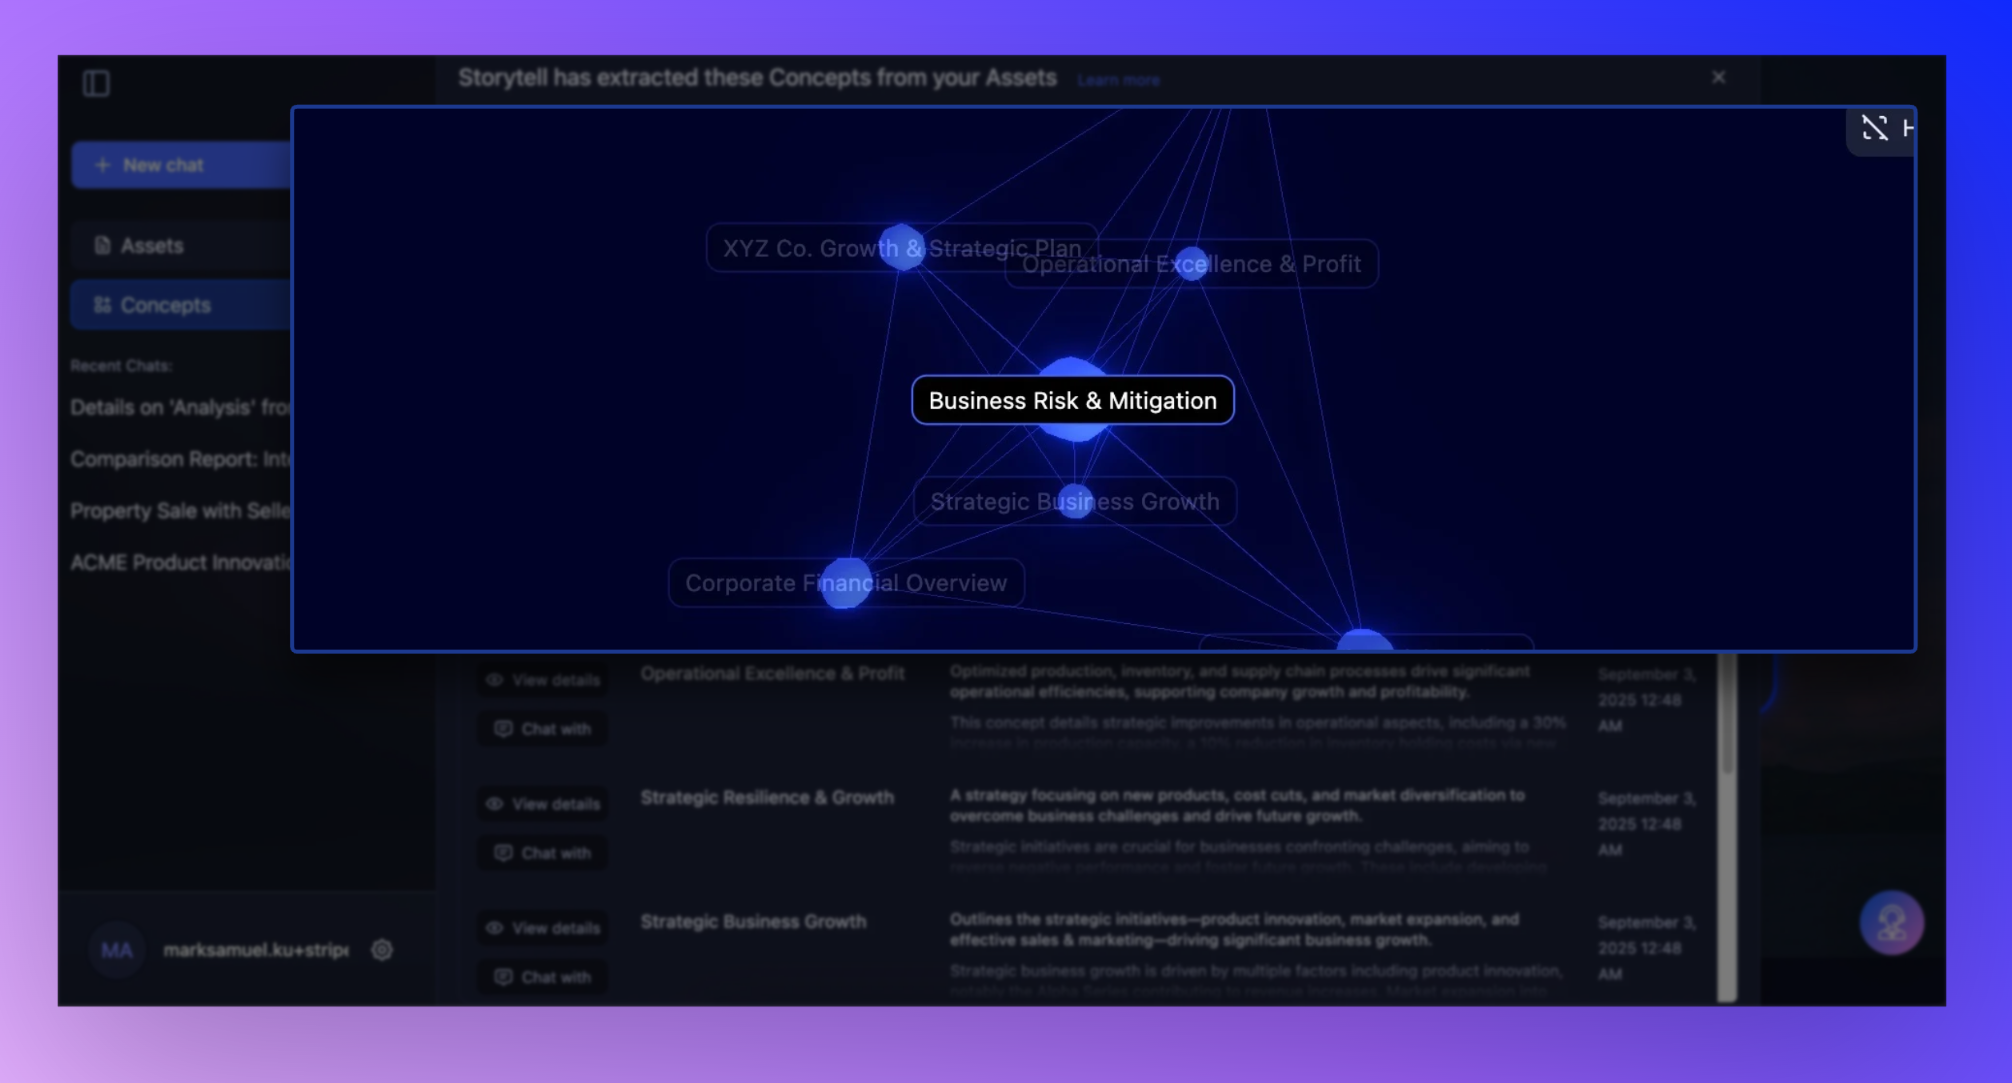
What it is: The Concept Graph is a 3D visualization that plots every concept as a node in a network. The lines connecting them represent their relationships, allowing you to see at a glance how different ideas link together.
Why it matters: It moves beyond linear lists to help you discover hidden connections and understand the bigger picture.
How it works: Simply navigate to the Concepts tab in the sidebar. You can explore the graph by:
Left-click and drag to rotate the graph
Use the mouse wheel to zoom in and out
Right-click and drag to pan across the view
Get started here: Concepts overview