January 7th, 2026
New
Improved
Fixed
Create full presentations and data visualizations
Happy New Year everyone! We've been heads-down shipping some of our most requested capabilities, and this release is packed with features that fundamentally change how you work with Storytell. From generating complete slide decks to getting expert-level questions about your data.
Create Full Presentations Right in Storytell
This is the big one. Storytell can now generate complete slide presentations directly from your conversations—no more copy-pasting into PowerPoint or Google Slides.
What makes this special:
When you ask Storytell to create a presentation about your data, project findings, or analysis, it builds an entire deck with multiple slide types, professional layouts, and visual polish. Think title slides, content slides with bullet points, image slides, two-column comparisons, section headers, and more.
Who benefits most:
Anyone who needs to present insights or findings—product managers preparing stakeholder updates, consultants building client decks, researchers sharing results, team leads creating project reviews. If you've ever thought "I wish I could just ask for a presentation about this," that wish just came true.
How it works:
Just ask Storytell to create a presentation about whatever you're discussing. The presentation appears right in your SmartChat™ with an interactive viewer where you can flip through slides, change themes (13 professional options to choose from), and export when you're ready.
Your export options:
PDF - Download a pixel-perfect PDF that matches exactly what you see in Storytell
Google Slides - Export directly to Google Slides with full formatting preserved
Save to Knowledge - Add the presentation to your project's knowledge base so you can reference it in future conversations
The presentation tool works seamlessly with images and charts generated by Storytell's other tools, so you can create fully visual, data-rich decks without leaving your conversation.
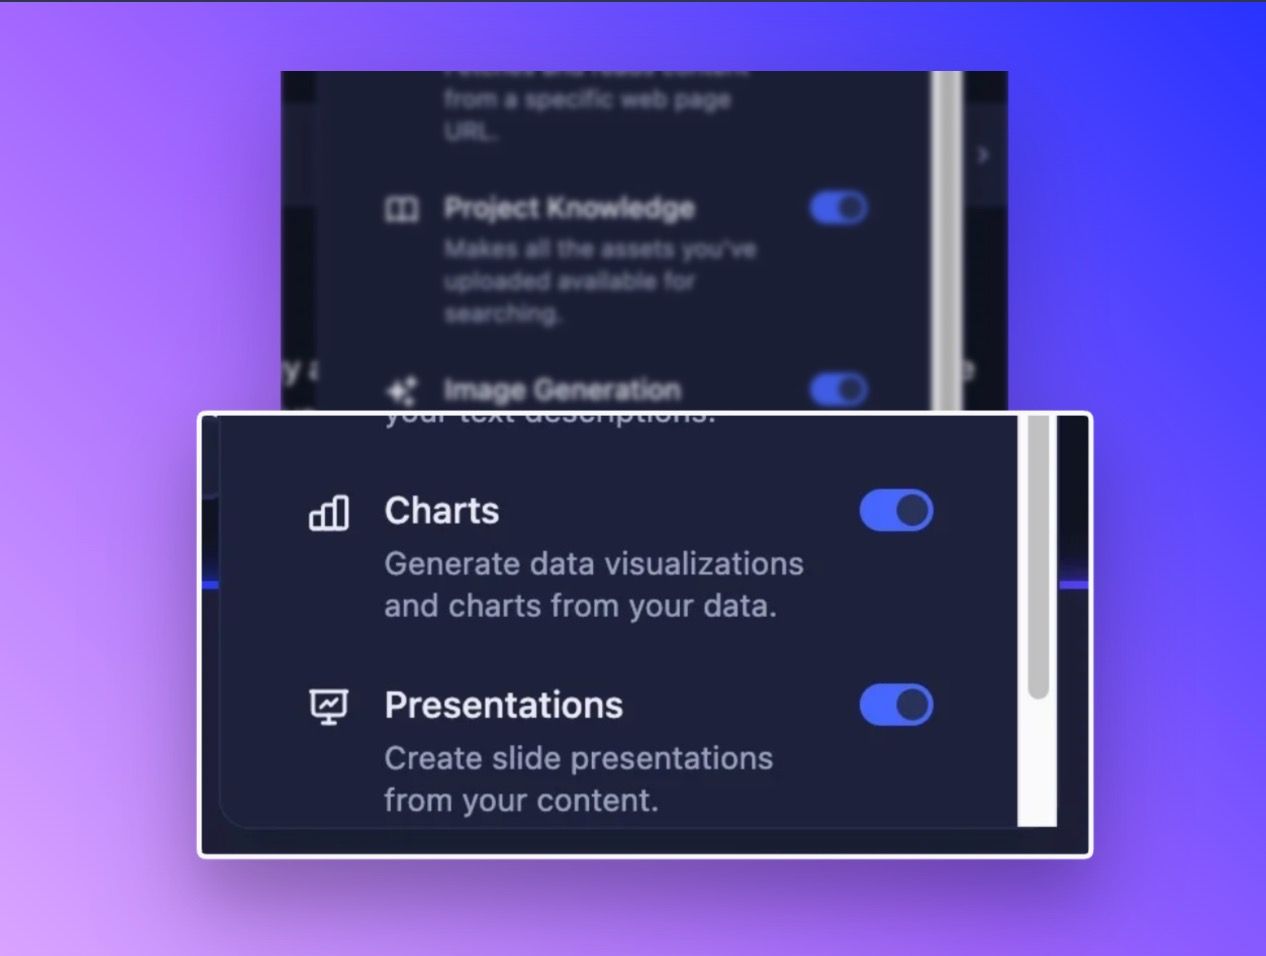
Generate Charts for Your Data
Along with presentations comes a dedicated chart generation capability. Storytell can now create bar charts, line charts, pie charts, doughnut charts, area charts, and scatter plots from your data.
These aren't just thrown into presentations—they're standalone visualizations you can generate anytime you need to see patterns, compare metrics, or share insights visually. Ask for a chart, and it appears in your conversation ready to export or include in other content.
✨ Improvements
Improve Prompts Moved to a Better Home
We've moved the Improve Prompts feature from its own button into the 3-dot menu, giving you more control and a cleaner prompt bar.
Three modes to choose from:
Off - Disabled entirely
On - Get prompt improvement suggestions on-demand (now the default)
Auto - Automatically applies improvements as you type, with an undo button when you want to revert
The menu shows your current mode at a glance, and we've added smart safeguards like requiring at least 3 words before triggering improvements and a 1.5-second debounce to prevent excessive processing.
🔧 Bug Fixes
Chat URL Parameter Fixed
The ?chat= URL parameter feature (which auto-submits a prompt when you open Storytell from a link) wasn't reliably working in production. We've rebuilt this with proper timing coordination and duplicate prevention, so sharing Storytell links with pre-filled prompts now works consistently.
Other improvements in this release:
Added missing labels and text to presentation export buttons based on early feedback
Fixed Chrome memory management issues during presentation generation
Fixed a bug where the chat deletion button could still be clicked when disabled